
Will COE prices fall after the 2026 EV rebate deadline?

Cat A COE premiums fell 15.3% in January 2024, from a December average of $86,510 to $73,300. Cat B fell 17.9%, from about $120,051 to $98,505. Those are monthly averages of the two bidding exercises, which you can explore in our historical COE chart.
Both drops came as lower vehicle rebates took effect.
With EV rebates shrinking again after 2026, waiting could mean bidding after the registration rush has cleared.
Early 2024 gave buyers a cheaper window
From January 2024, the EV Early Adoption Incentive (EEAI) cap fell from $20,000 to $15,000. Vehicular Emissions Scheme (VES) Band A2 rebates also dropped from $15,000 to $5,000, alongside tighter emissions rules. LTA’s model examples show how the changes affected different cars.
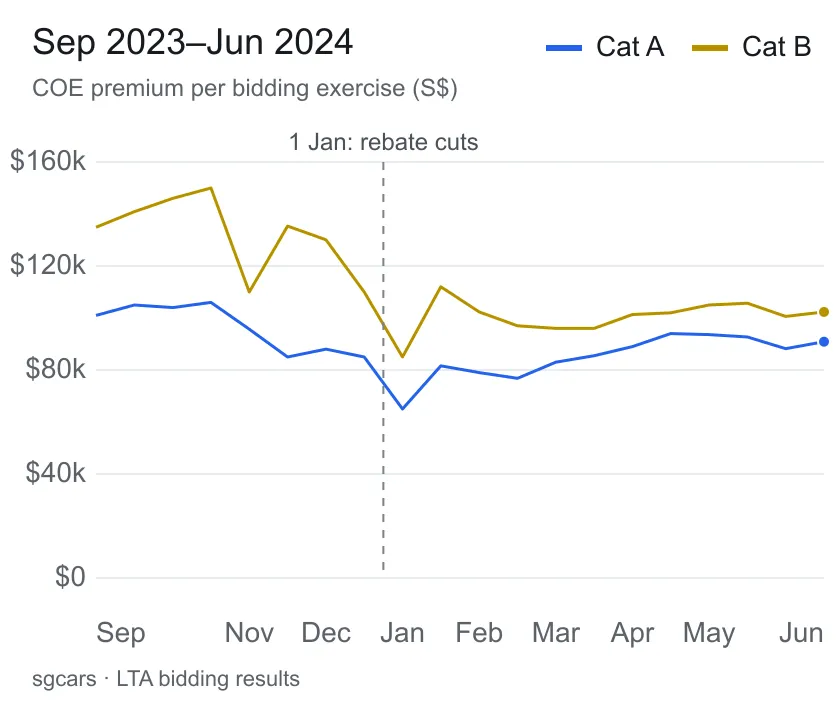
The dashed line marks the rebate cut. Tap the graph to inspect the bidding rounds.
Across January–March, Cat A still averaged 9.3% below December and Cat B 18.3% below. Buyers had several rounds of lower premiums.
Most mass-market EVs retained their existing EEAI benefit; the lower cap didn’t mean every model lost $5,000. For those models, lower COE could mean a cheaper purchase without losing incentives.
By June, Cat A averaged about $89,545, above the preceding December. Cat B remained lower at about $101,471.
And the graph shows why we can’t put the whole fall down to the rebate deadline. Premiums were already falling from October, while LTA raised the November 2023–January 2024 quotas for both car categories by 35% over the preceding quota period. The extra supply could also have contributed to the decline.
Earlier changes were followed by falls too
The first three months after the July 2015 Carbon Emissions-Based Vehicle Scheme (CEVS) revision averaged 10.6% below June for Cat A and 16.1% below for Cat B. After VES replaced CEVS in January 2018, the corresponding declines against December were 4.0% and 18.8%.
Those are calculations from LTA’s historical bidding results. Neither change was simply an EV rebate expiring: the 2015 revision changed emissions bands, while VES introduced additional pollutants.
Supply also expanded around the 2015 change. The quota offered in July–September was about 26% higher than April–June for Cat A, and 17% higher for Cat B. The historical case for waiting is stronger when a rebate deadline coincides with more COEs becoming available.
What changes after 31 December 2026?
The EEAI ends on 1 January 2027. VES continues, with a smaller rebate for its cleanest car band. Together, maximum support falls from $30,000 to $20,000 under LTA’s incentive schedule.
| ARF rebate | 2026 | 2027 |
|---|---|---|
| EEAI maximum | $7,500 | $0 |
| Cleanest VES band | $22,500 | $20,000 |
| Combined maximum | $30,000 | $20,000 |
These offset the Additional Registration Fee (ARF); individual cars may receive less. Eligibility follows registration, so signing an order before New Year’s Eve doesn’t secure the old rebates.
When it announced the cuts for 2026, LTA expected a short-term increase in COE prices. A pre-deadline rush could leave fewer buyers afterward, although it doesn’t establish how far premiums might fall.
January 2026: a closer comparison, a smaller payoff
The January 2026 change cut combined maximum EV support from $40,000 to $30,000. Hybrids also lost their VES rebates. It’s a closer comparison with the upcoming deadline than the older changes, although it still wasn’t an identical policy event.
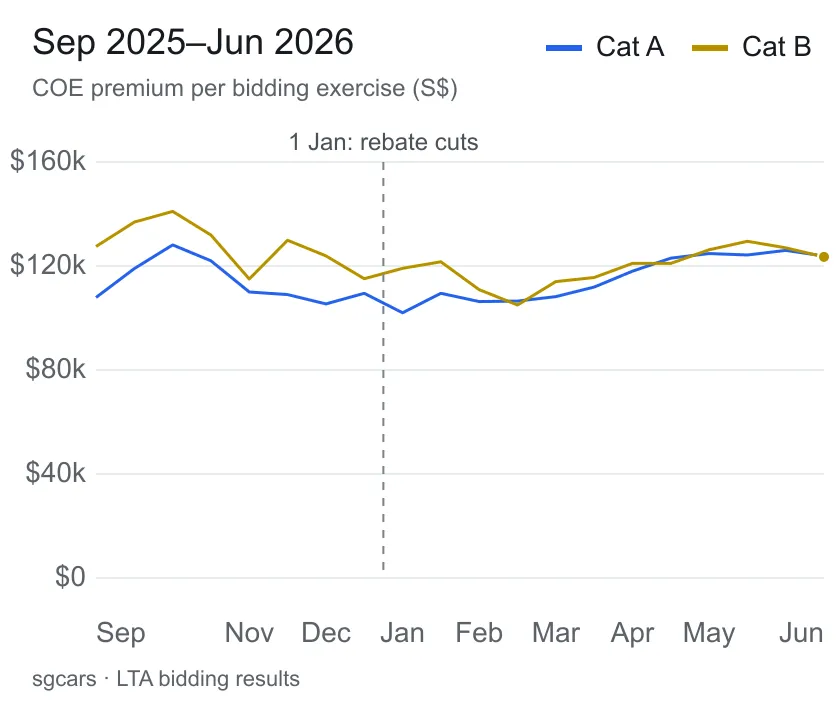
The same price scale as the 2024 graph; the table averages individual bidding results.
| Average premium | Cat A | Cat B |
|---|---|---|
| Dec 2025 | $107,457 | $119,501 |
| Jan–Mar 2026 | $107,407 | $114,366 |
| Change from December | About 0% | −4.3% |
| Jun 2026 | $124,928 | $125,246 |
Cat A’s first-quarter average barely moved from December. Cat B offered some relief, but by June both were above their December averages. These calculations use the actual premiums in LTA’s 2025–2026 results, rounded to the nearest dollar.
Comparing early 2026 with October 2025 would show a larger fall, but much of it happened before the deadline. December better reflects the choice of waiting across year-end.
Explore both episodes in our interactive COE price chart, and select a round to see its premium.
The COE fall has to cover what you lose
For a car losing the full $10,000 in incentives next year, a $5,000 COE fall would still leave you paying $5,000 more, assuming the rest of the price stays the same.
There are competing pressures too. The 2027 VES schedule raises surcharges on more pollutive cars. Some buyers may switch models while still competing for a COE. A smaller EV rebate doesn’t automatically remove those buyers from the auction.
Ask the dealer for the model’s actual 2026 and 2027 rebate difference, then compare complete prices with the same COE terms. Manufacturer price changes or discounts could move the calculation again. Our COE reform explainer makes the same point about looking at the whole purchase price.
For a car losing $10,000 in rebates, a $10,000 COE fall only gets you back to the same upfront price. You’d need a bigger fall to come out ahead (assuming the car’s own price behaves itself).